
The question
Imagine a travel company looking to add accommodation options to its Asheville travel packages. Which ZIP codes should we explore first to find potential host partners?
I used this question to give the analysis a direction. For this scenario, I focused on entire homes and apartments, where guests would have a place to themselves. I wanted to find areas with plenty of properties to consider, signs of recent guest activity, and a sense of the prices we might encounter.
The results point to 28806 and 28801 as starting places:
| ZIP | Entire-home listings | With a review in the past 12 months | Average listed price |
|---|---|---|---|
| 28806 | 706 | 81.0% | $179.43 |
| 28801 | 502 | 84.1% | $189.82 |
| 28732 | 68 | 86.8% | $218.29 |
28732 has the highest recent-review coverage, but only 68 entire-home listings. By comparison, 28806 and 28801 offer much larger pools while still showing recent reviews across most properties. That gives our hypothetical company more leads to investigate.
SQL: getting the data ready
I started by importing the raw CSVs into MySQL and creating working tables. Before comparing areas, I needed to make sure prices could be calculated, dates could be grouped, and missing values would not distort the results.
I checked listing IDs for duplicates, trimmed text, converted numeric and date fields, and turned blanks into NULLs. 340 of the 2,876 listings had no price, so I kept them for property counts but left them out of price averages. I also checked the 263 listings with missing review dates and monthly review figures: they had no reviews. High prices were inspected rather than automatically deleted.
Next came the business choices behind the queries. The neighbourhood field contained ZIP codes, so that became our way to compare areas. Splitting listings by room type helped avoid comparing a private room with an entire house. I then narrowed the partnership analysis to the 2,571 entire homes/apartments.
With clean tables, I joined reviews to listings, compared areas, and used CTEs and window functions to calculate median prices and examine host groups. This query asks what share of entire-home listings in each ZIP had at least one review in the past year:
SELECT
    neighbourhood AS zip_code,
    COUNT(*) AS total_listings,
    ROUND(100.0 * AVG(number_of_reviews_ltm > 0), 1)
        AS pct_with_recent_reviews
FROM asheville_airbnb.listings_clean
WHERE room_type = 'Entire home/apt'
GROUP BY neighbourhood;
Excel: connect, summarize, and check
I exported the cleaned listing and host tables from SQL as CSVs and brought them into Excel. I used an exact-match VLOOKUP to bring each host’s listing count into the listing table, then IF to classify hosts. A PivotTable compared prices and recent reviews within room types. I reconciled the results with SQL rather than treating the spreadsheet as a separate answer.
For entire homes, multiple-listing hosts averaged $213.34, compared with $165.52 for single-listing hosts. That gave me another question for outreach: would hosts managing several properties offer a useful way to find multiple accommodation options through one contact?
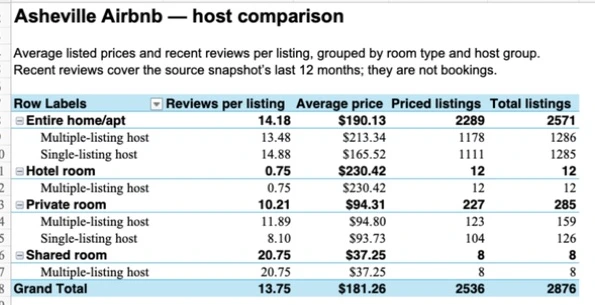
Tableau: bring the decision together
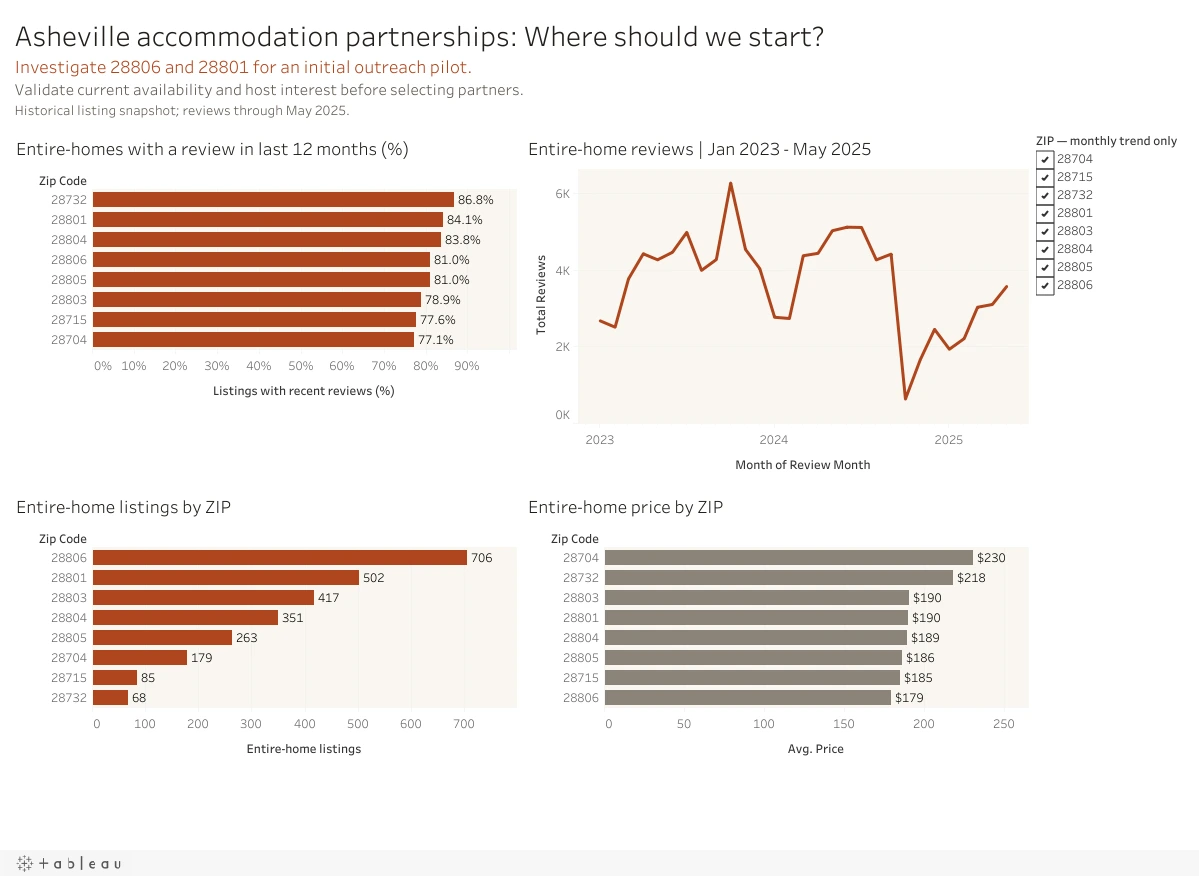
I brought the SQL exports into Tableau to put the comparisons in one place. The listing-level table supports the property counts, prices, and review coverage. A calculated 1/0 field marks whether each property had a recent review; averaging it gives the percentage shown in the chart.
For the timeline, I used a separate export grouped by month and ZIP, covering January 2023–May 2025. Keeping that separate avoids repeating each property’s price for every review it received. The ZIP filter changes the monthly trend while the other charts keep the area comparisons visible.
Together, the four charts help answer: where do we have more potential leads, how widespread is recent guest activity, what do listed prices look like, and how has activity changed over time?
Interactive view loads from Tableau only when you choose Explore dashboard. On a small screen, open Tableau directly for more room.
Conclusion
I would start researching hosts in 28806 and 28801, then use property suitability, availability, and conversations with owners to narrow the list.
The October 2024 drop stood out during the analysis. It follows Hurricane Helene’s devastating flooding in Asheville in late September, so I would read it in that context rather than as an ordinary seasonal dip. Reviews picked up afterward, although January–May 2025 remained below the same months in 2024.
For our travel company, that makes checking conditions with hosts especially important. The data helps us decide where to look; it cannot tell us which homes are ready to welcome our guests or which owners want to partner with us. Reviews give us a clue about guest activity, but we do not have booking records to measure how full those properties were.
Files and source
Source: supplied Inside Airbnb Asheville files. The downloads retain the analysis steps and working formulas; SQL cleaning assumes the raw CSVs have been imported into MySQL.
Validation and conversions; run sequentially on a fresh analysis schema.
Pricing, medians, host comparisons, and review trends.
Listing and host tables used for lookup practice.
ZIP comparisons and monthly review activity for entire homes.
Source tables, VLOOKUP, IF, and the host-comparison PivotTable.
Editable dashboard with its two CSV sources included.