
Executive Summary
Horizon Financial Group’s loan portfolio had a 24.29% default rate, roughly double its 12% target. Credit score produced the clearest separation: 49.14% of loans in the 520–599 range defaulted, compared with 11.69% for borrowers scoring 750 or higher.
Default risk also rose sharply when debt-to-income ratio reached 40%, and borrowers with less than two years of employment defaulted substantially more often. Loan purpose showed smaller differences, while defaulted loans were only 2.53% larger on average than non-defaulted loans.
How I analyzed the loans
I loaded the borrower and loan files into MySQL, checked the tables for missing or unusual values, and joined them on borrower_id. The combined analysis contains 601 loans across 500 borrower profiles.
Most questions were answered with grouped SQL queries and CASE statements. Because defaulted is coded as 1 for a default and 0 otherwise, its average directly produces the default rate (neat!):
ROUND(AVG(defaulted) * 100, 2) AS default_rateCredit score was the clearest risk separator
Default rates declined consistently as credit scores improved. The 750+ group was the only score range below the company’s 12% target.
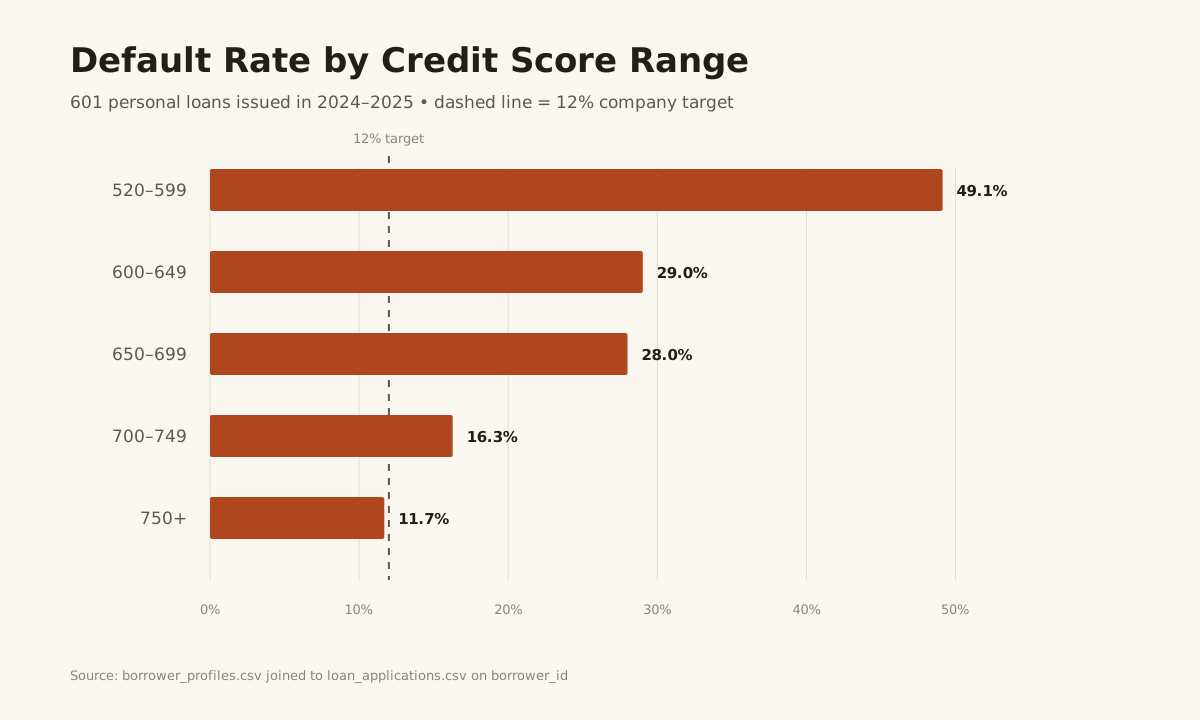
| Credit score | Loans | Defaulted loans | Default rate |
|---|---|---|---|
| 520–599 | 116 | 57 | 49.14% |
| 600–649 | 93 | 27 | 29.03% |
| 650–699 | 75 | 21 | 28.00% |
| 700–749 | 86 | 14 | 16.28% |
| 750+ | 231 | 27 | 11.69% |
Default risk jumped at 40% DTI
The default rate increased from 11.21% in the 30–39.9% DTI group to 23.71% in the 40–49.9% group, then continued rising. Loans below 40% DTI had a combined 12.88% default rate, so 40% is a useful preliminary screening threshold but does not reach the target by itself.
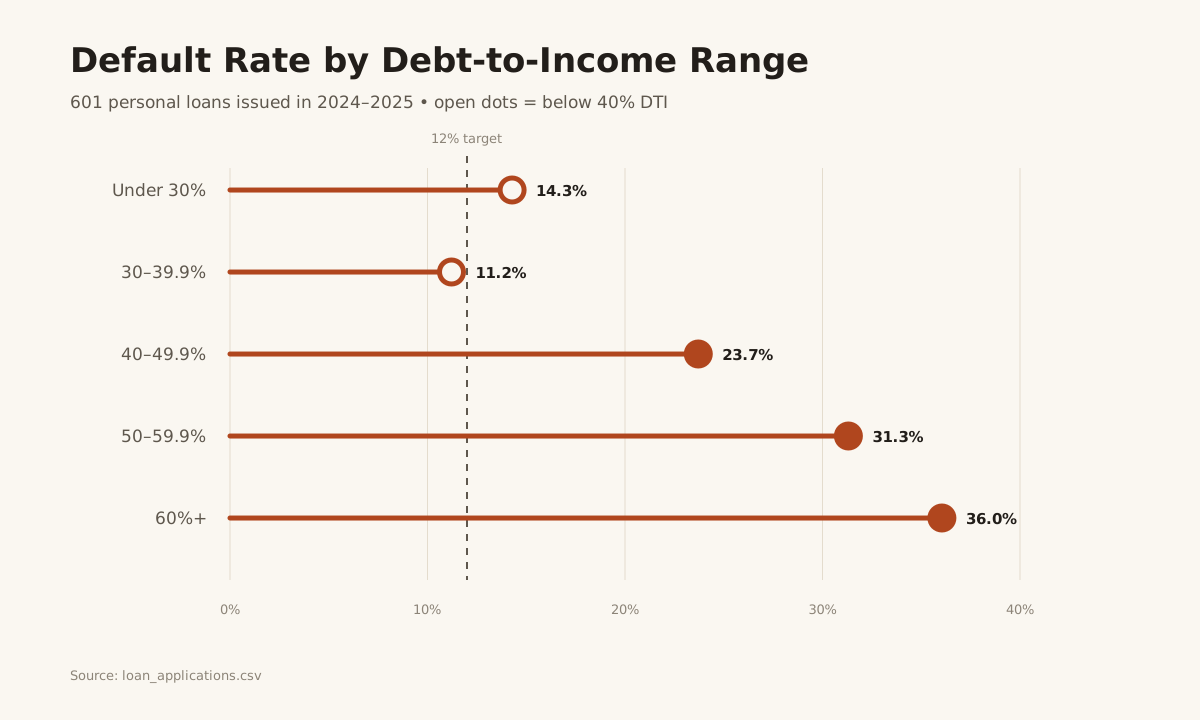
| DTI range | Loans | Default rate |
|---|---|---|
| Under 30% | 126 | 14.29% |
| 30–39.9% | 107 | 11.21% |
| 40–49.9% | 97 | 23.71% |
| 50–59.9% | 99 | 31.31% |
| 60%+ | 172 | 36.05% |
Employment length mattered more than employment type
Default rates by employment status were fairly close, ranging from 22.73% for contract workers to 27.69% for part-time workers. Employment length showed a clearer difference.
| Employment length | Loans | Defaulted loans | Default rate |
|---|---|---|---|
| Less than 2 years | 84 | 29 | 34.52% |
| 2 or more years | 517 | 117 | 22.63% |
Borrowers with less than two years of employment defaulted 11.89 percentage points more often than borrowers with longer employment histories.
Purpose and loan size were weaker signals
Wedding loans had the highest purpose-level default rate, followed by home improvement and auto loans. However, every purpose had a default rate above 20%, making purpose less useful than credit score for separating risk.
| Loan purpose | Loans | Default rate |
|---|---|---|
| Wedding | 56 | 32.14% |
| Home Improvement | 70 | 28.57% |
| Auto Loan | 59 | 27.12% |
| Medical Expenses — lowest | 68 | 20.59% |
Defaulted loans averaged $22,570.55, compared with $22,012.75 for non-defaulted loans (a difference of just 2.53%). Loan amount alone did not meaningfully distinguish risk in this portfolio.
Recommendation
- Treat scores below 700 as higher risk and require stronger compensating factors; 750+ was the only bucket that met the 12% target on its own.
- Use 40% DTI as a preliminary maximum, with stricter review as DTI approaches that threshold.
- Apply additional review when the borrower has less than two years of employment history.
- Do not use loan purpose or loan amount as standalone rejection rules; their differences were much weaker.
These indicators should be used together rather than as automatic approval or rejection rules.
Limitations
This is an educational portfolio dataset, so the findings demonstrate analytical technique rather than a production-ready lending policy. The analysis identifies associations, not causes. It also uses the supplied defaulted flag, where current and late loans are counted as non-defaulted at the time of the dataset snapshot.
Download
Includes the joins, score and DTI buckets, grouped default-rate queries, and written findings.