
Why I built Chestnuts
Before moving into data, I spent over three years as a financial advisor. A big part of that job was education: explaining how investing works and helping people feel confident enough to get started. Apps like Acorns do a version of that for people who may never sit down with an advisor. They make investing simpler and less intimidating, and they help people build a habit over time. I believe in that mission, and it is what drew me to this project.
Acorns in particular made me curious about what happens behind the app. It is best known for round-ups: it rounds your everyday purchases up to the next dollar and invests the spare change. But before anyone gets to that point, they have to sign up, verify their identity, link a bank, move money in, wait for it to arrive, and make a first investment. That part works much the same at any investing or brokerage app, and it is where people can get stuck. I wanted to understand how a data analyst helps a product team get more people through it.
The problem was data. Customer data from an investing app is private, and for good reason. So I built my own: Chestnuts, a fictional investing app whose name is a nod to Acorns. I wrote the rules for how it works, generated its users and transactions, and then analyzed that data the way I would at a real company. Nothing in it comes from Acorns.
Building the data myself also meant I had to decide exactly how every step worked before I could measure it. By the time I was counting conversions, I knew what each number was made of.
Starting with one question
Before writing any code, I picked the decision the analysis should support: what should the product team change to get more new users to their first investment within 14 days?
My first version of that question tried to do too much. It asked how to get more people investing, build a lasting habit, and avoid risk, all at the same time. So I narrowed it. The first investment became the main goal. Investing again later became a check on whether those first investments led anywhere. Failed transfers and similar problems became guardrails: things a change should not make worse.
To keep the questions grounded, I imagined how three teams would look at the same journey:
- Product: Where do people stop before their first investment, and which step should we fix?
- Operations: Are people running into failed attempts or delays, and can they recover?
- Finance: Is money actually arriving, and does a deposit turn into an investment?
Writing the rules, then the data
Next, I described how the app works. A new user goes through four steps: verify their identity, link a bank account, fund their account, and make a first investment. A deposit has to settle before that money can be invested. Along the way, people can retry a failed step, leave a transfer pending, or never finish.
I wrote those rules down in a data dictionary (what each table and column means) and an event list (which actions the app records). Then I wrote a Python script that creates users and moves them through the journey based on those rules, with enough randomness that no two people behave exactly alike.
I started small, with about 500 users, so I could follow individual people from signup to investment and make sure the data made sense. Once it did, I generated the full dataset of 10,000 users. I also set one rule for myself: once the data was generated, I would not go back and tweak the settings to get a more interesting result.
- 01DefineProduct rules & events
- 02GeneratePython · synthetic data
- 03TransformDuckDB & dbt
- 04AnalyzeSQL & experiment
- 05ExplainTableau & recommendation
Getting the data ready
I loaded the generated files into DuckDBA lightweight database that runs on your own computer, so you can query large files with SQL without setting up a server. and used dbtA tool for organizing SQL into a series of clean, tested tables, so each cleanup step can be checked and rerun. to turn them into clean tables ready for analysis. From there, I used SQL to follow each user from signup to their first investment.
Before counting anything, I had to decide who counts. Out of the 10,000 users, I left out 193 test accounts. I also set aside 324 people who had signed up too recently to have a full 14 days by the July 1, 2026 cutoff. They had not failed; they just had not had their full chance yet. That left 9,483 users with a full 14-day window after signup.
I also checked for the kinds of problems real data has, like the same event being recorded twice. And I kept three milestones separate because they are easy to blur together: submitting a deposit, having that deposit arrive, and actually investing it.
Where people dropped off
Of the 9,483 users, 7,217 verified their identity, 5,353 linked a bank, 3,801 funded their account (meaning their deposit actually arrived), and 2,897 made a first investment. That is 30.5%, or about three in ten.

Verification lost the most people: 2,266. Funding, though, lost the largest share. Of the 5,353 people who linked a bank, 1,552 (29.0%) did not fund their account within 14 days.
That made funding the step I wanted to understand. When I broke those 1,552 people down, 767 of them (49.4%) never submitted a deposit at all. The rest had a deposit that was still pending, had failed without a successful retry, or had been canceled.

One possible explanation was that the 767 simply ran out of time. They had not: every one of them still had nearly a week left in their window. They had all seen the funding screen, and none of them got as far as choosing an amount. The data could show me where they stopped, but not why. One idea was that the screen did not explain what happens after you deposit. That was something I could test.
Testing a small fix
I set up an experiment around that idea. Half of the eligible users would see the standard funding screen. The other half would see the same screen with three short sentences added:
You choose how much to deposit from your linked bank. Your deposit becomes available after the transfer settles. Once it is available, you can place your first investment.
This experiment tracks two outcomes that sound alike but are not the same:
- Submitting a deposit means the user asked to move money from their bank into Chestnuts. That is the step the guidance is about.
- Completing a first investment means that money actually arrived and the user then used it to buy investments. That is the goal of the whole journey.
A lot can happen in between. The transfer can fail, still be pending days later, or get canceled. And some people never place their first investment even after the money lands. So someone can submit a deposit and still not end up investing.
That is why I measured success by whether people completed a first investment within 14 days of assignment. Deposit submissions were something to watch along the way, not the finish line.
Before running anything, I wrote down what would count as success and what would count as harm. Success was a five-point practical goal: first investments going up by at least five percentage points. For harm, I set a two-point harm limit: failed transfers should not go up by more than two points. Deciding this up front kept me from moving the goalposts after seeing the results.
Since Chestnuts is simulated, I also had to decide how users would react to the guidance. I gave it a modest nudge at one point only: people who saw it were somewhat more likely to start a deposit. Everything after that, from whether the transfer went through to whether they invested, followed the same rules for both groups. I generated the experiment as its own dataset, so the original data stayed untouched. The real question was whether that nudge would carry all the way through to a first investment.
I randomly assigned 3,400 users: 1,669 to the standard screen and 1,731 to the guidance. Everyone stayed in their group for the analysis, including the 149 people who never reached the funding screen. Leaving them out would have meant comparing only the people who showed up, which is no longer a fair comparison.
What the experiment showed

See the exact rates
| Outcome | Standard | Guidance | Change |
|---|---|---|---|
| Submitted a deposit | 81.31% | 88.62% | +7.31 pp |
| Completed a first investment | 50.15% | 52.51% | +2.36 pp |
Deposits went up clearly. In this simulation, more people asked to move money in when they saw the guidance. It raised deposit submissions by 7.31 percentage points, or roughly seven more people out of every 100. The 95% confidence intervalThe range of effects that fit the data. If the whole range is above zero, the change most likely helped. If it crosses zero, the data cannot rule out no effect. ran from +4.92 to +9.71 points, so even the low end is a real improvement.
First investments were less certain. The share of people whose money arrived and got invested rose by an estimated 2.36 points, but the interval ran from −1.00 to +5.72 points (p-value: 0.168). That range covers a small drop, no change at all, and a gain bigger than my five-point goal. So the test did not show a clear increase in investments. It also did not prove there was no benefit.
This is where the difference between the two outcomes matters. Every extra deposit still has to arrive and then get invested, and some people drop off at each of those steps. So a lift in deposits does not have to show up at full size in first investments. The test was also sized to detect a five-point gain, so it could not reliably pick up a smaller one.
The safety check came back uncertain too. The share of users with a failed transfer rose by an estimated 1.45 points, which is under my limit, but the interval reached 3.34 points, above it. So I could not say the change was safe to roll out either.
One note on these numbers: the experiment starts counting when people reach the funding step, not at signup, and only includes people who had already linked a bank. That is why its rates are much higher than the 30.5% from the funnel, and the two should not be compared directly.
Do first-time investors come back?
A first investment matters less if people never invest again, so I also looked at what happened afterward. Among users I could follow long enough, 632 of 2,188 invested again in Week 12: 28.9%. Week 12 here means days 84–91 after their first investment.

That does not mean those users invested every week. Someone could invest in Week 1, skip a month, and come back in Week 12. Each week in the chart only counts users who had been around long enough to reach it, so the groups overlap. They are not the same people being tracked over time.
What I would recommend
Continue testing funding guidance, and keep the first investment as the measure of success. The jump in deposits is promising. But the experiment did not show that more people invested, and it did not rule out more failed transfers. Rolling it out now would mean judging it by the deposit number instead of the investment number, which is the one that matters.
If Chestnuts were a real product, my next steps would be:
- Run a new, larger test of the guidance, big enough to measure both first investments and failed transfers with confidence.
- Look into pending and failed transfers to see where people get stuck while waiting for their money, and whether they find their way back.
- Come back to identity verification. It lost the most people overall, and I have not yet looked into why.
I also built a Tableau workbook with three views: an overview of where people drop off, a closer look at the journey and repeat investing, and the experiment results with their uncertainty.
What I took away
The biggest lesson was to keep the recommendation tied to the outcome that matters, even when an earlier step shows a stronger result. The deposit number looked like a win, and it would have been easy to lead with it. But the point of the journey, and of apps like this, is helping people actually start investing, and on that measure the honest answer was “not sure yet.”
An inconclusive result was still useful. It told me what the next test needs: more users and a closer eye on failed transfers.
If I keep building Chestnuts, the next piece would be the Acorns-style features I left out, like round-ups and recurring investments, and whether they help people keep investing after that first step.
Explore the workbook
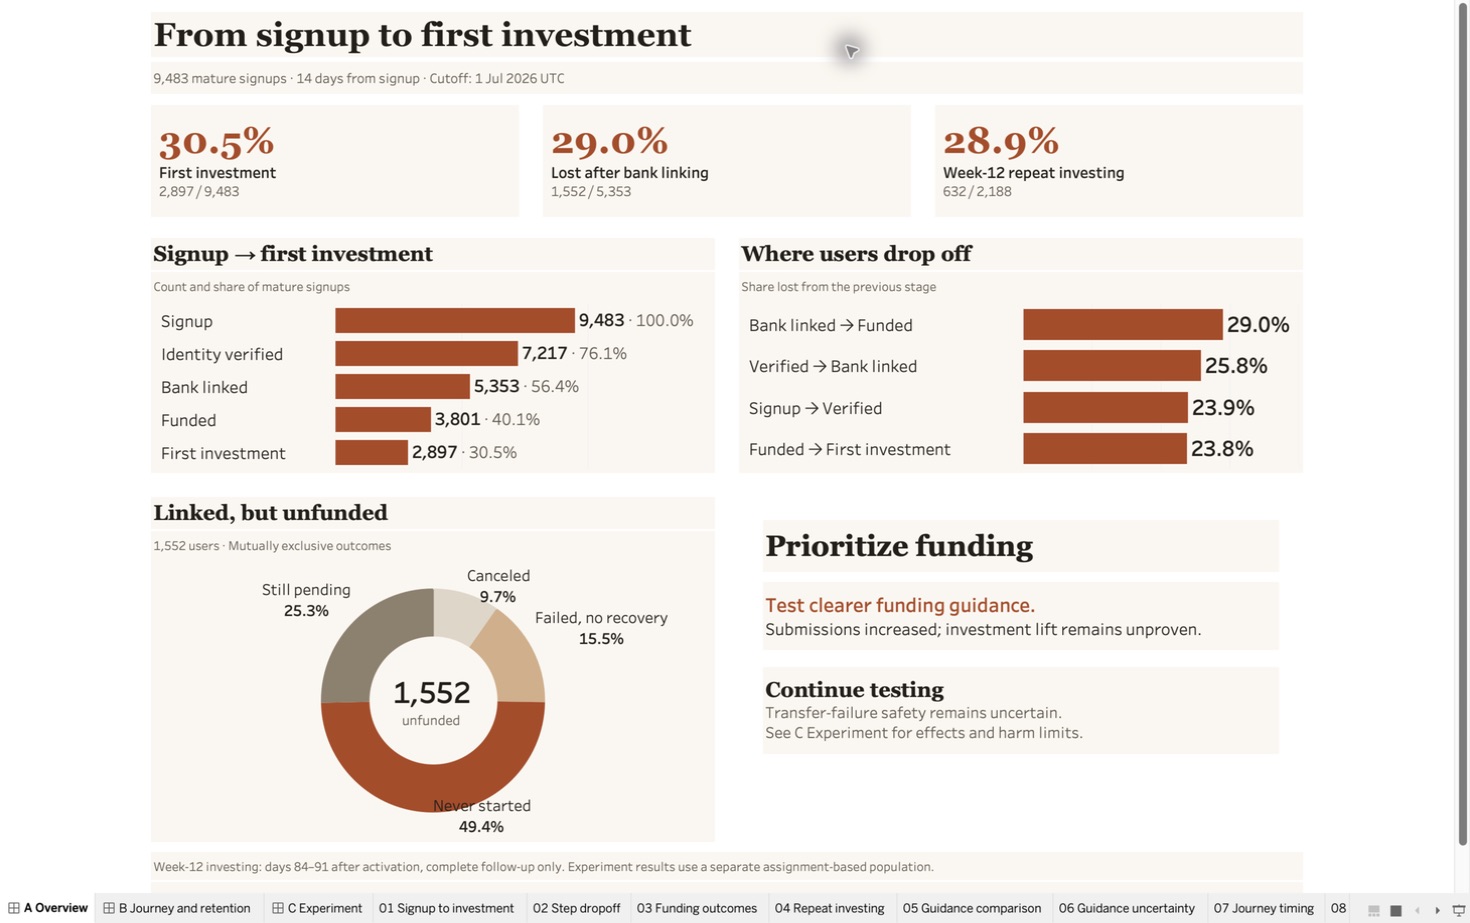
Tableau workbook
Explore the journey
Three views: the overview, journey and retention, and experiment.
Download the Tableau workbookChestnuts is an independent portfolio project using fully synthetic data. It is inspired by common consumer-finance product analytics problems and is not affiliated with, endorsed by, or based on internal data from Acorns.